Duck Donuts
Duck Donuts®
Business Model Overview
Duck Donuts franchises operate quick-serve outlets offering fresh, made-to-order donuts prepared on the premises, along with other breakfast items, gourmet coffee, and merchandise. The business serves the general public in a quick-serve setting for on‑ and off‑premises consumption. Significant revenue streams identified in the FDD include sales of donuts and other breakfast items, gourmet coffee, and retail merchandise.
Pros & Cons Analysis
Pros
Cons
Legal Risk Score
A 2022 California consent order resolved claims the franchisor ran Google click ads and offered a franchise while its Disclosure Document wasn’t effectively registered; Duck Donuts paid a $5,000 penalty and agreed to comply. This isolated regulatory misstep suggests modest compliance risk, but prospective franchisees should monitor registration and marketing practices.
Territory Protection Score
The franchisee receives a 'protected' but not exclusive territory, a common but less safe arrangement. However, the franchisor can reduce the territory for non-performance and sell online into the area, and the franchisee lacks a right of first refusal—undermining exclusivity and yielding a weak score (19/100).
Training & Support Score
Rated 60, Duck Donuts' (2025) training and support is standard: it includes on-site training and a solid amount of instruction (about 80 hours) for up to four people, which supports launch readiness; however, on-site support incurs additional fees and living expenses are not covered, increasing franchisee outlays.
Executive Summary
This opportunity requires a substantial upfront investment — beyond a non‑refundable $40,000 initial franchise fee, material build‑out and equipment costs are large (leasehold improvements $270k–$405k; FF&E $110k–$137k), making total startup capital costly. Performance data (Item 19) show average gross sales of $577,748 and a median of $548,298 across 96 outlets, but wide dispersion (low $202k, high $1.32M; top quartile ~$848k, bottom quartile ~$373k) and a modestly low stability metric indicate variable outcomes and a high‑risk performance profile for some operators. Operational and structural risks are noteworthy: territory protection is weak (score 19) with the franchisor able to sell online and shrink territories, training/support is adequate but carries extra fees and mandatory personal management/full‑time requirements, and a 2022 regulatory consent order (small penalty) raises a moderate compliance flag. Taken together, the brand shows noteworthy growth and topline potential for strong locations but also meaningful capital, territorial and execution risks that could affect returns.
Performance Analysis
For None, the total_units_growth chart (None total units growth from 2022 to 2024) documents the change in overall unit count across the period, and the unit_mix chart (None unit mix from 2022 to 2024) shows how that change was allocated among different unit types. Prospective franchisees should use the total_units_growth trend to assess whether the brand is in an expansion, plateau, or contraction phase and review the unit_mix to determine if growth is broad‑based or concentrated in particular formats—information that signals scalability, market momentum, and potential operational or competitive risks.
Key Performance Indicators
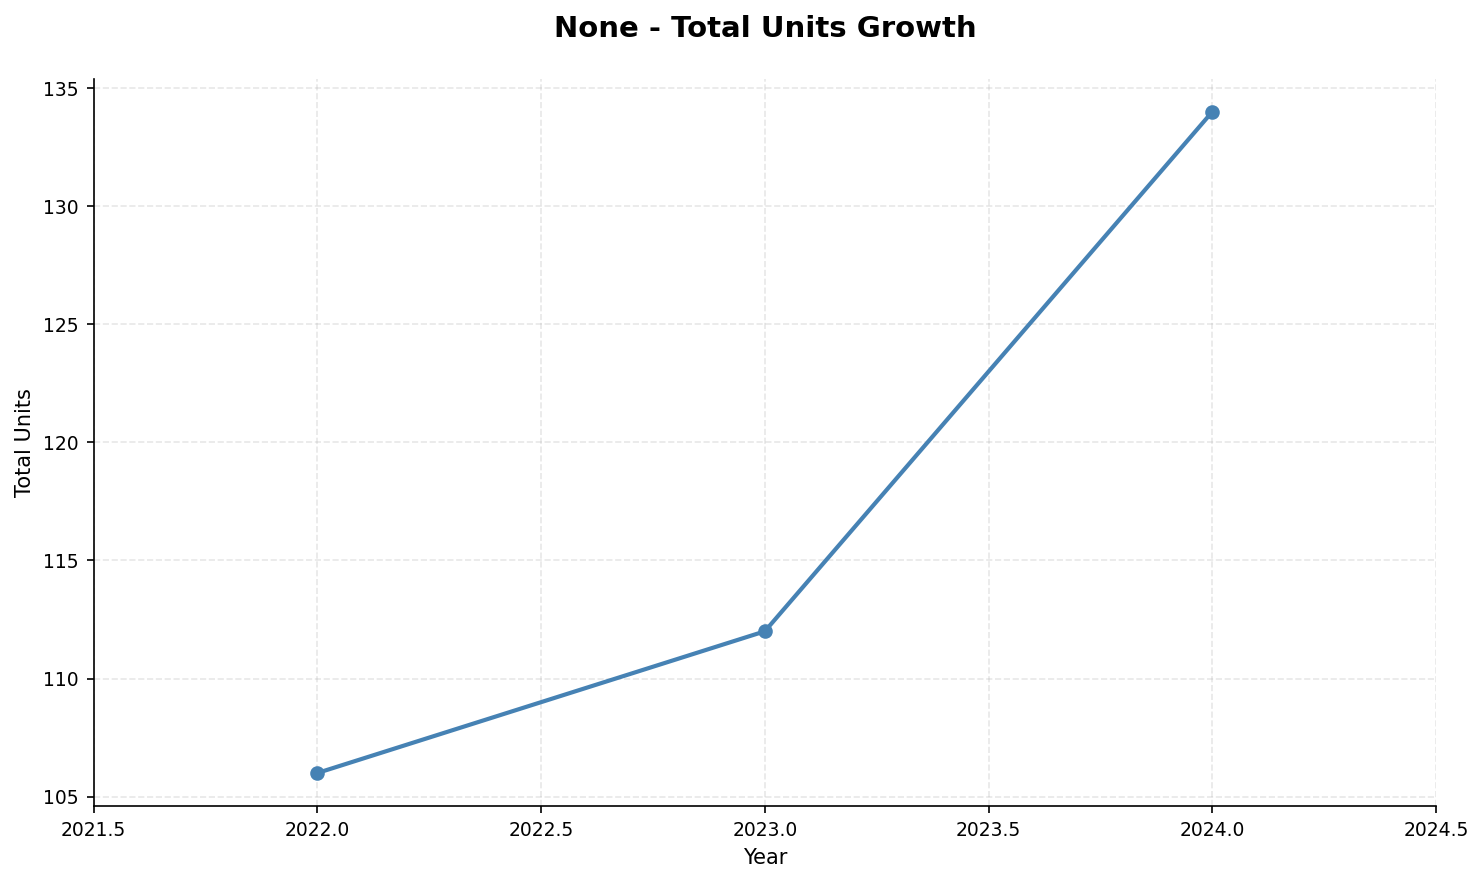
None total units growth from 2022 to 2024
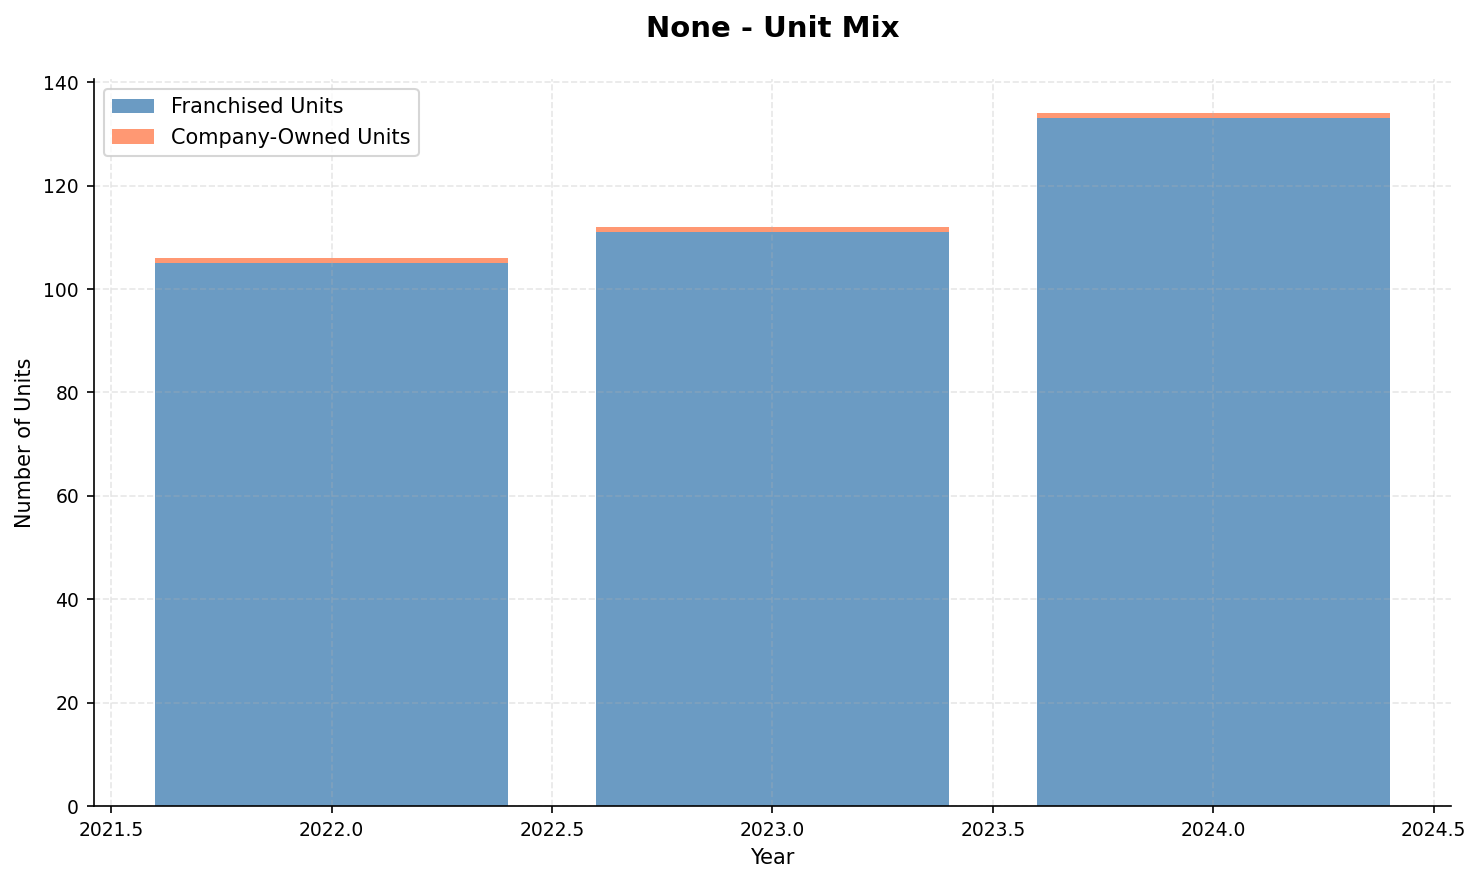
None unit mix from 2022 to 2024
Financial Performance Analysis (Item 19)
Investment Requirements
Interested in Duck Donuts?
Get more information and connect with the franchise directly.